
Psorcast
Understanding psoriatic disease symptoms and how they change between clinical visits.
Product Design
Branding
User Research
Digital health measure design
About
Using a large open source data set, Psorcast aims to make, or help other scientists make, forecasts for outcomes like treatment effectiveness and development of arthritis.

The Problem
Psoriasis, a chronic autoimmune skin condition, impacts 7.4 million US adults, with one-third progressing to psoriatic arthritis unpredictably. The manifestation of symptoms is influenced by a combination of genetic, environmental, and lifestyle factors. While discovering a targeted therapy can be transformative, the absence of markers makes it challenging to determine its effectiveness for individual patients.
Research
Upon completing user research, we uncovered the critical need to predict psoriatic arthritis, flare-ups, and remissions for effective therapeutic interventions. Users expressed frustration with the limited comprehension of their condition and available treatments. Consequently, our solution aimed to seamlessly integrate into their daily lives, providing a sense of empowerment and control over their condition.
The Findings
Anchor into daily routine
Users needed to understand what was working and what was not. Therefore what we created had to be anchored into their daily lives easily.
Detect and forecast condition
Users needed to be able to use this tool to see how their treatments were/were not working and to be able to share that with their care team.
Empower and support
Users were frustrated by the inability to find treatments that worked. They needed to feel supported and empowered to learn about their condition on their journey.
Digital Health Measures
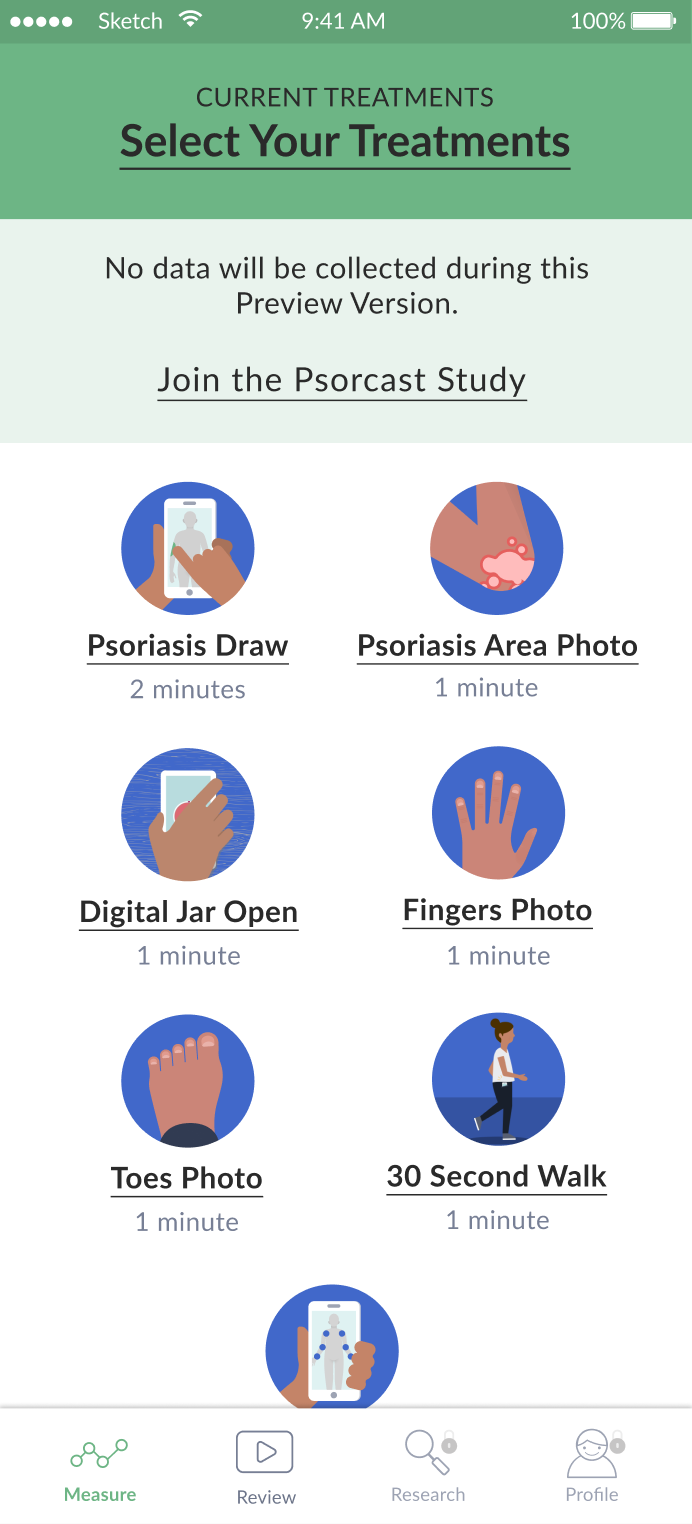
It became evident that phone-based sensors offered a fitting solution for psoriatic disease. By leveraging accelerometers and gyroscopes embedded in the user's mobile device, we could accurately gauge functional movement, potentially predicting the onset of psoriatic arthritis. Additionally, utilizing the phone's camera, we enabled users to capture images of their plaques and joints, facilitating the measurement of disease progression.
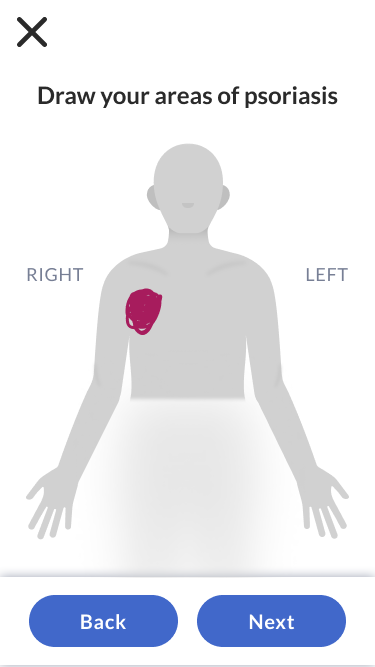
Body Surface Area Assessment
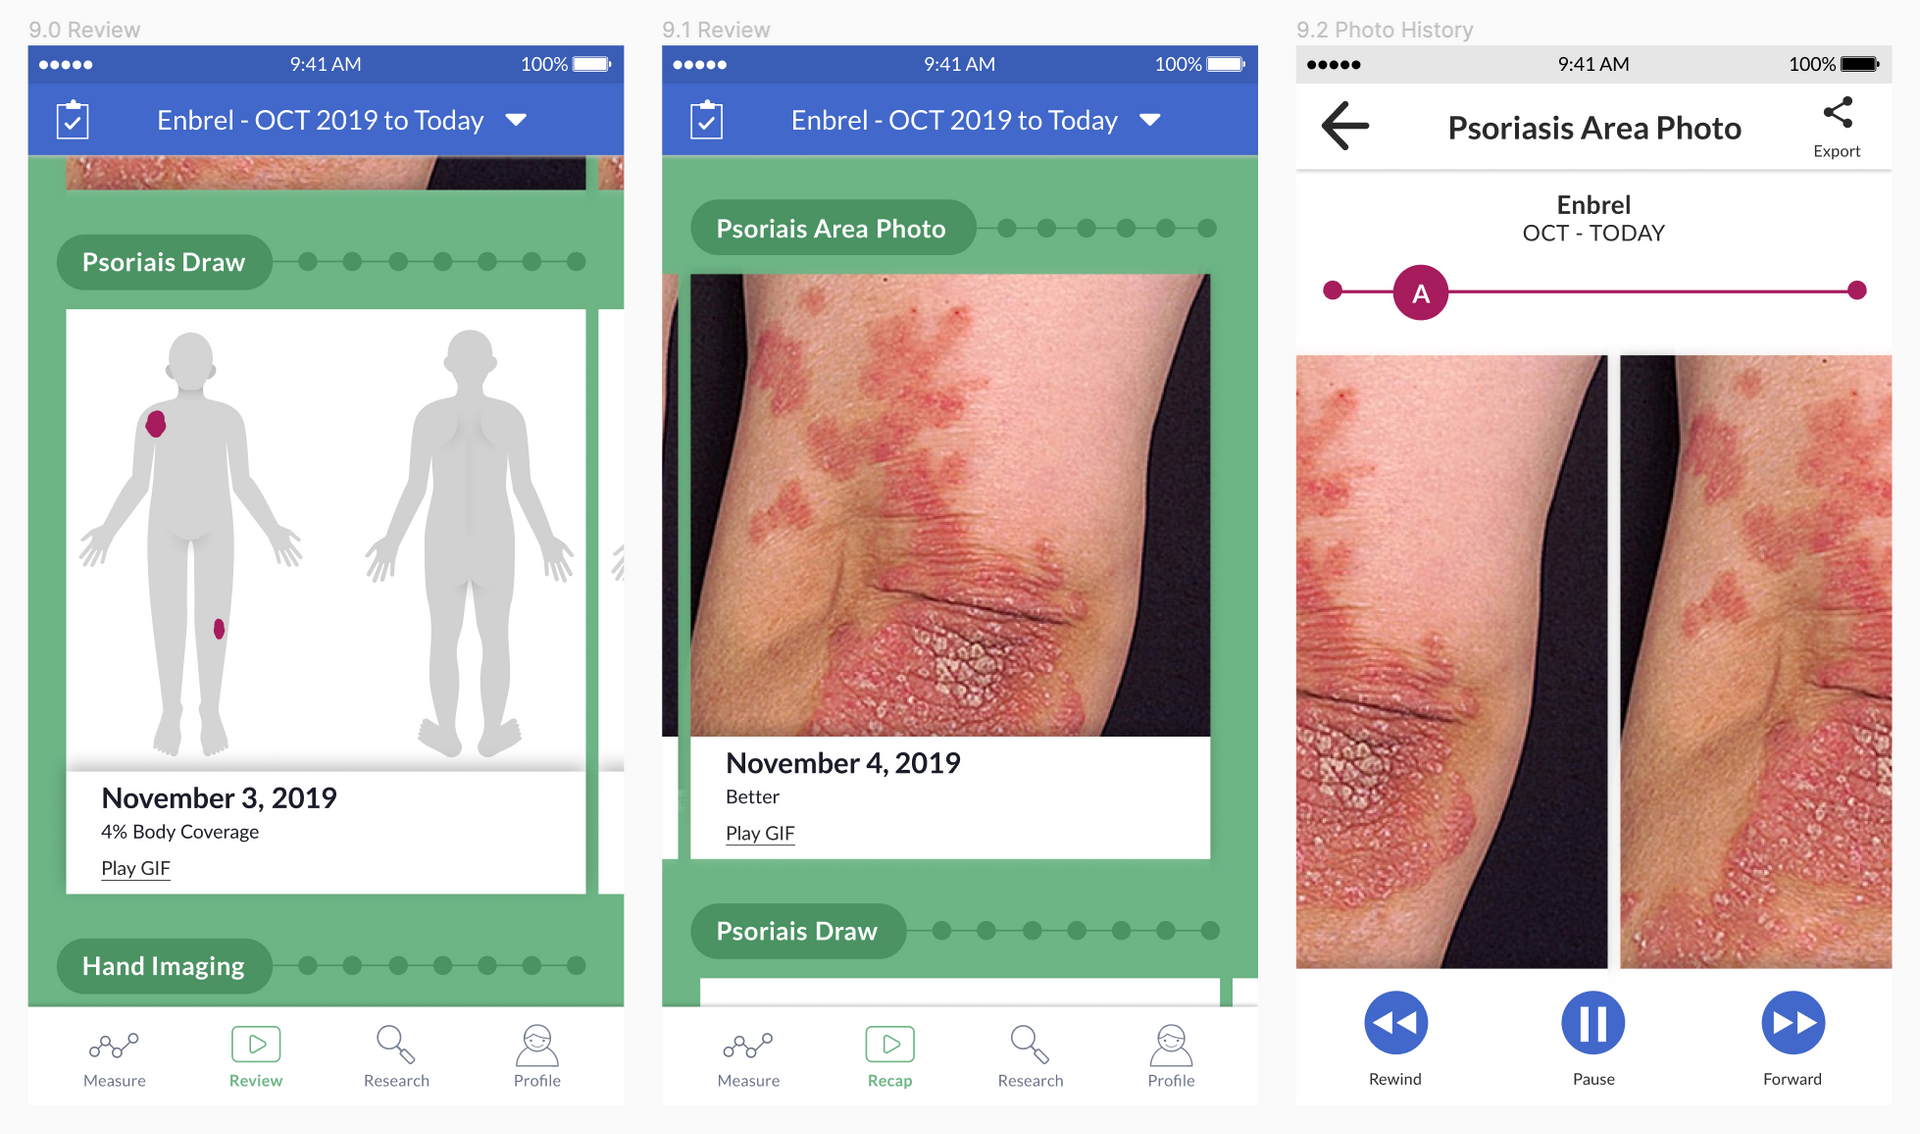
Employing established standards for measuring psoriasis coverage and severity, we created a digital assessment enabling users to visually draw their plaque coverage, thus determining the extent of their psoriasis. Post-activity, users receive a percentage output, with the added feature of tracking their progress over time to monitor the evolution of their condition.
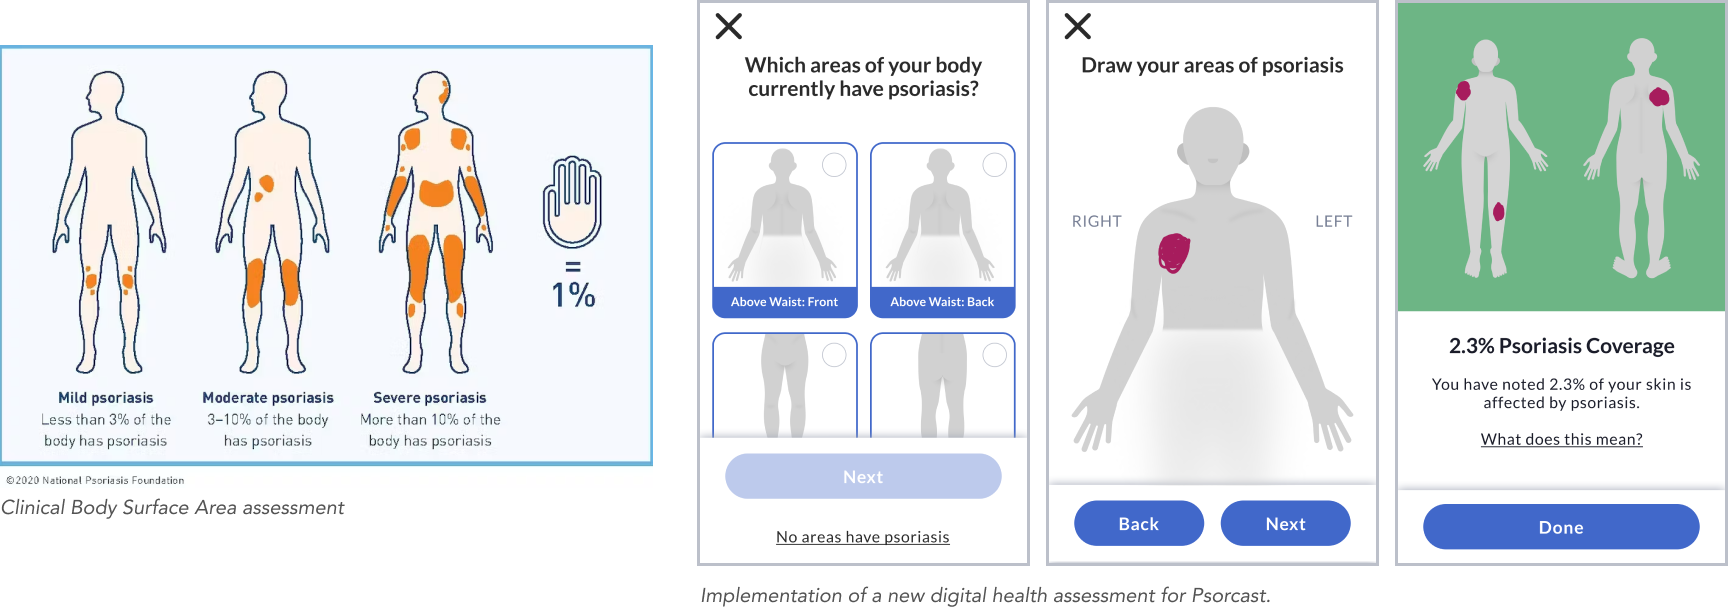
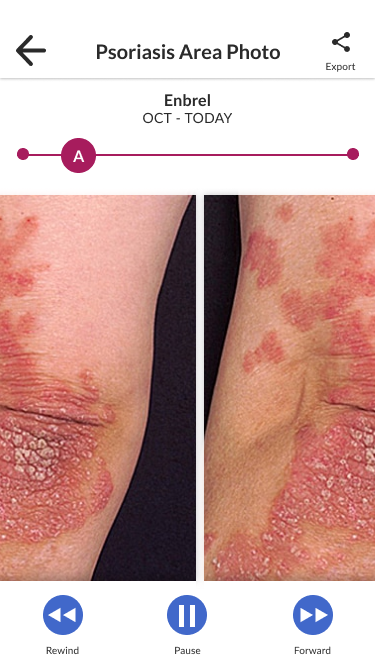
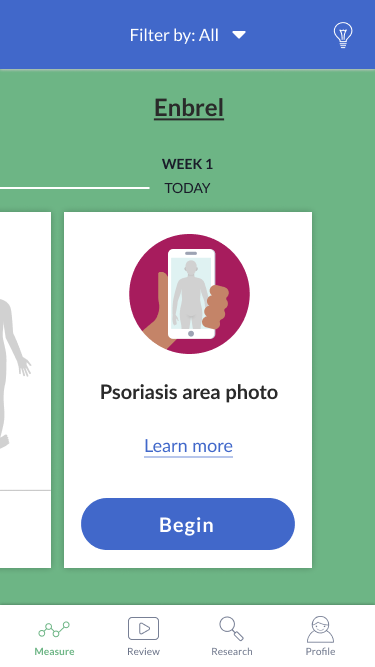
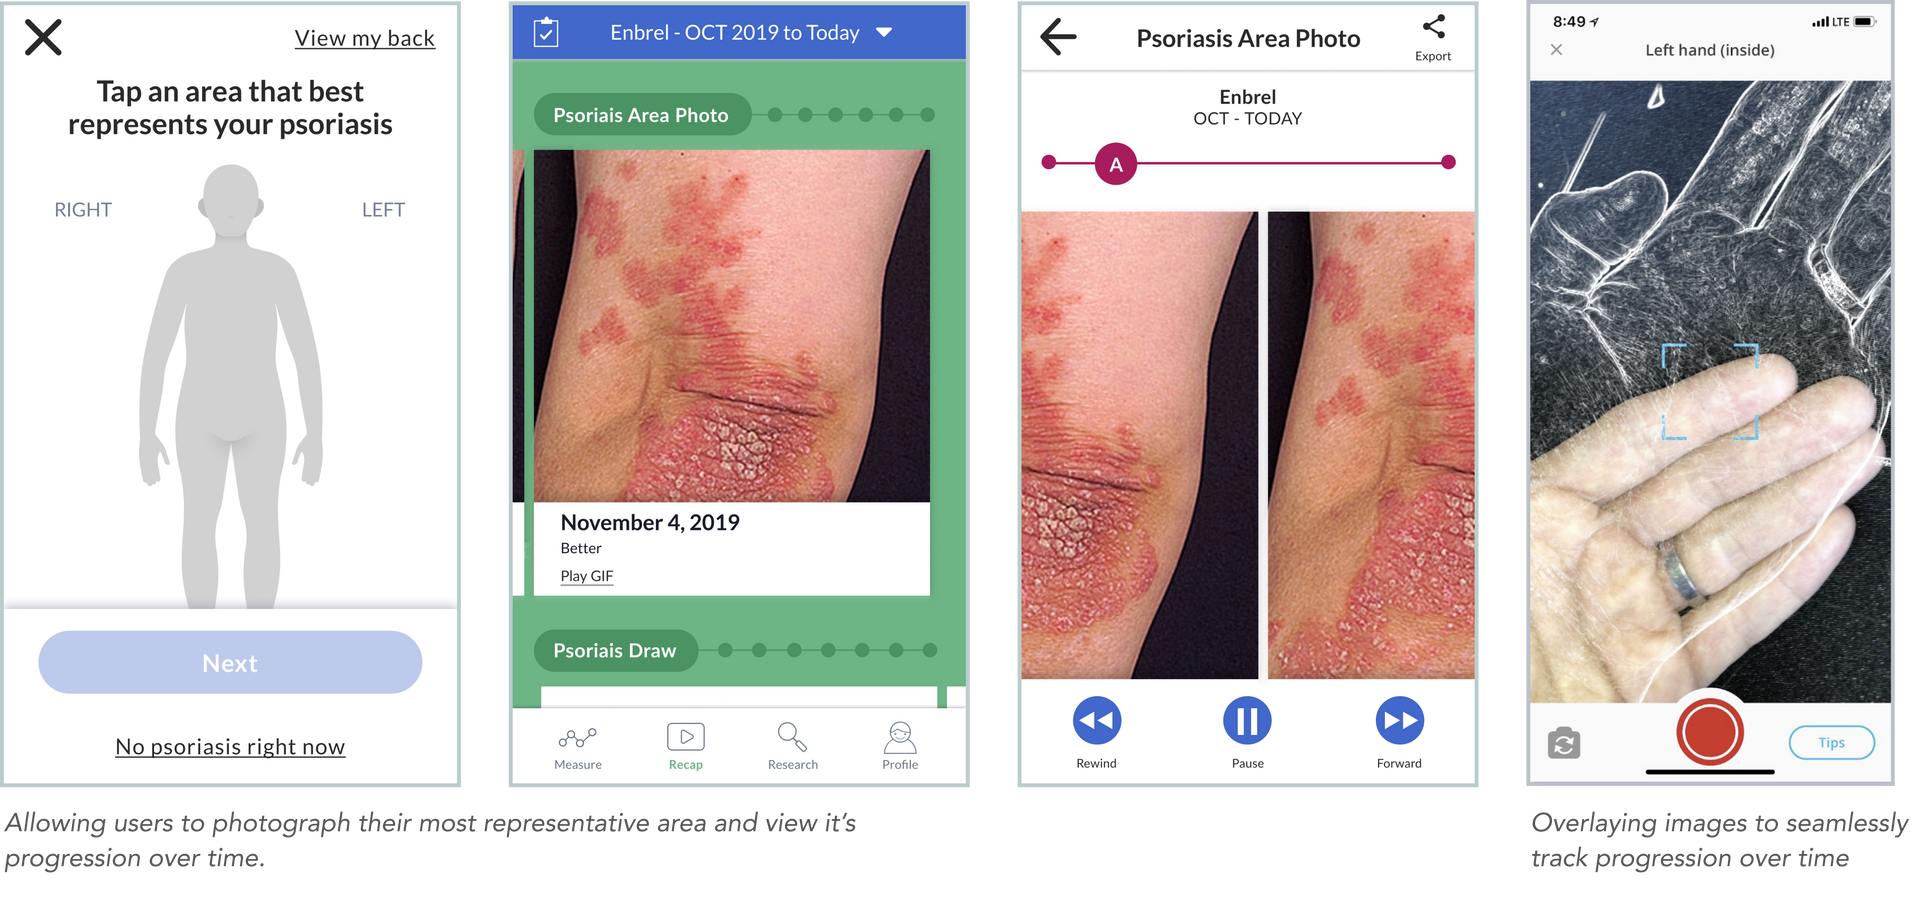
Psoriasis Area Photo
By utilizing their phone's camera, users had the capability to capture images of their most representative area and observe changes over time. After generating an initial image, a ghost image was superimposed during the photographing stage. This allowed users to align the image with their previous one, ensuring consistent placements and generating a .gif that visually depicted the progression of their condition over time.
Design
Allowing users to 'try before they buy'
Just as with mPower, users were frustrated going through a full consent process just to try the application and see if they could benefit from it. We instituted a new idea to 'try before you buy'. Users were able to test out the various assessments and get feedback without the application collecting any data from them. We made it easy for them to sign up for the research study at any time if they so choose, also allowing them to get access to more features.
Forecasting their condition
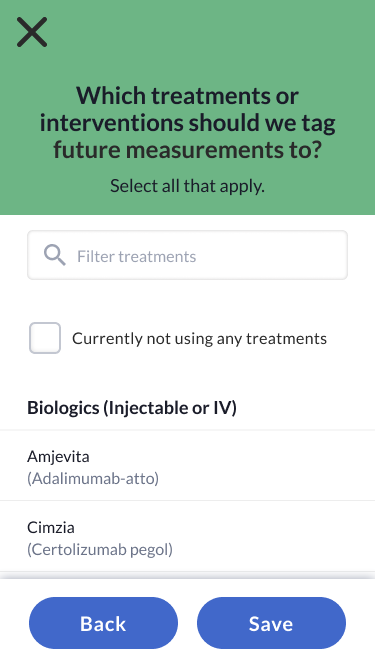
Frequent engagement with Psorcast allowed users to forecast their condition. The Review tab allowed users to view all of their activity history, and filter it by time ranges as well as medications and treatments. Activity was compressed into a timeline of sorts within each activity and upon engagement allowed users to view a .gif of their condition's progression. They could export their .gifs to share with their care team for treatment as well.
Branding
The logo was created to have two views, one for the user and one for the researcher. For researchers, the pink waves were a scientific representation of multiple distributions in a population (something researchers call a kernel density estimate (KDE)). The first wave with a larger distribution on the left and the smaller distribution on the right represents the Psoriatic Arthritis risk within the population. To the user these waves could be viewed as their psoriasis plaques or as charts which represent their disease progression. The rounded and bubbly nature of the font selection was to subliminally echo the nature of arthritis while keeping the application's style friendly, positive and approachable.
